 CollectorCtrl
Global Tap Templates & Custom Processor Auto-Chaining
Configuration Blueprint
YAML Composition & Option A Signal Affinity Auto-Chaining
The Global Tap Template is the master YAML blueprint that defines how telemetry taps are synthesized, filtered, processed, and exported across all collectors in your organization.
By leveraging standard OpenTelemetry Contrib processors (including OTTL transforms, filter processors, attributes processors, and probabilistic samplers), the template enables platform teams to establish standardized edge tap configurations across heterogeneous fleets and address issues like log fragmentation without having to hand-edit individual collector YAML configs.
 Expand
1. What is the Global Tap Template?
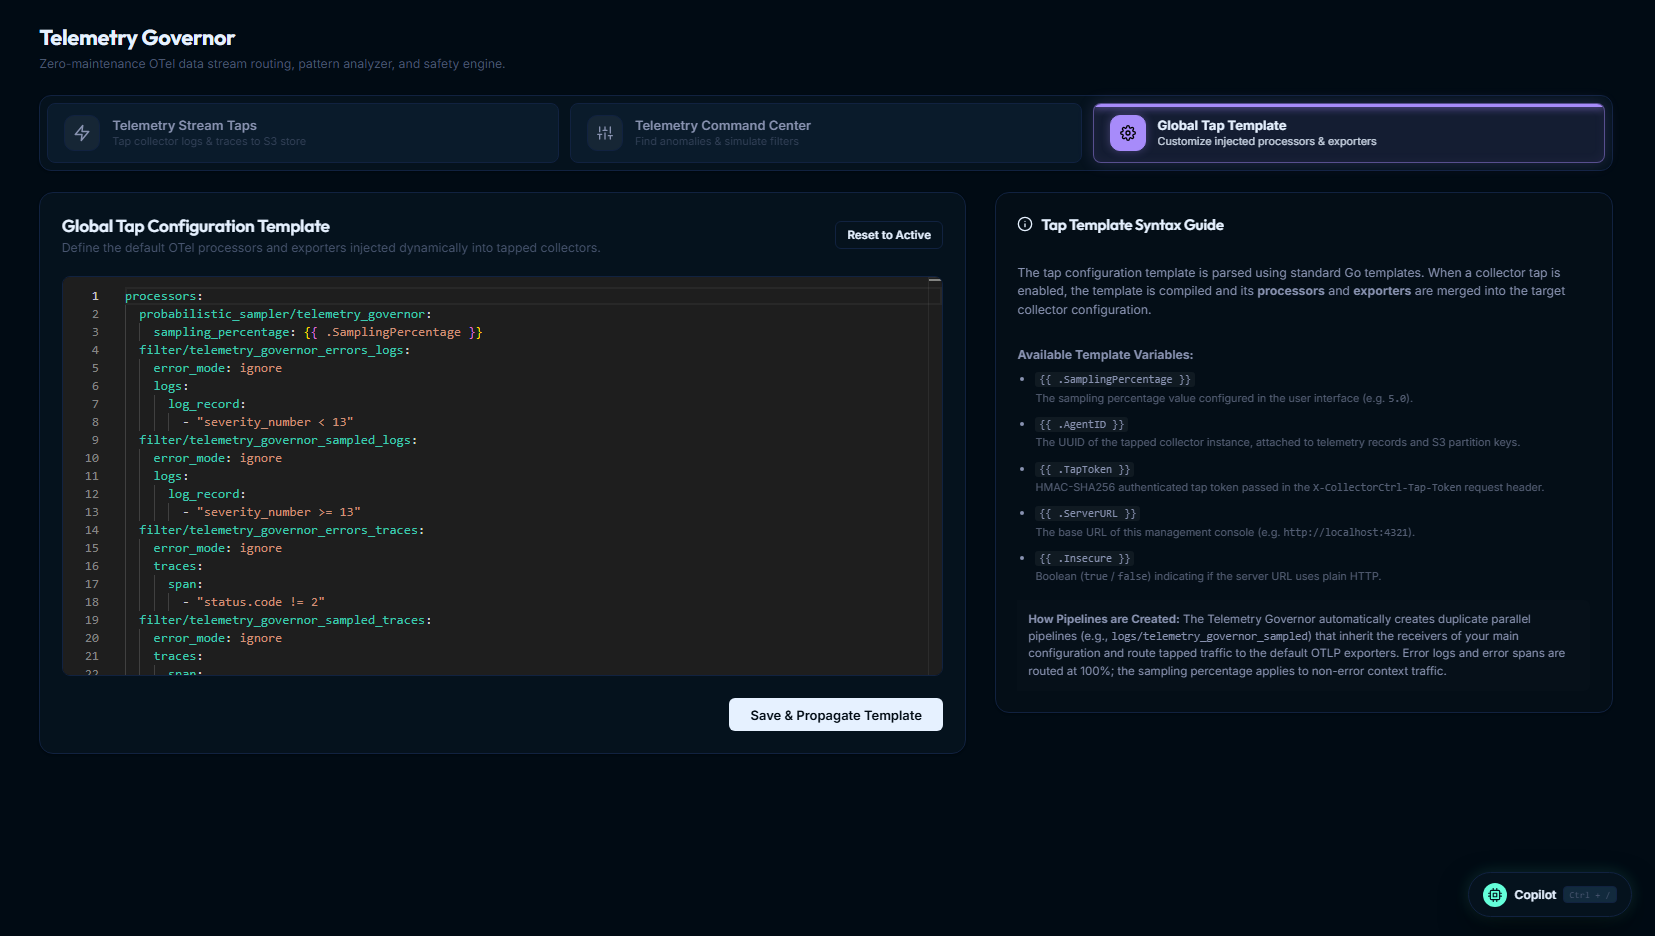
Whenever a stream tap is toggled ON for an OpenTelemetry collector, CollectorCtrl takes the collector's baseline configuration, compiles the Global Tap Template with agent-specific context parameters, and dynamically merges the tap processors, exporters, and parallel pipelines.
- Fleet-Wide Tap Standardization: Enforces consistent tap profiling logic (such as one sampling rate for every severity on the secondary tap stream) across all collectors, regardless of whether they run on Linux, Windows, Kubernetes, or edge nodes.
- Fixing Log Fragmentation & Noise: When insights in the Command Center reveal recurring log fragmentation (e.g. split multiline stack traces or missing severity levels), you can incorporate OTTL statements or recombination rules directly into the template and propagate the fix across all collectors.
- Safe Fleet Propagation: Inspect and customize this blueprint anytime in the Telemetry Governor console under the Global Tap Template tab. Click Save & Propagate Template to broadcast updates fleet-wide, or Reset to Active to discard uncommitted draft edits.
2. Template Context Variables
CollectorCtrl evaluates the TAP YAML template dynamically per agent using standard Go templating. The following context parameters are automatically populated:
| Variable | Type | Description | Example Resolved Value |
|---|---|---|---|
{{ .ServerURL }} | string | Resolved CollectorCtrl ingestion base URL. Automatically resolves COLLECTORCTRL_URL, LAN IP, or localhost. | https://telemetry.corp.internal:4321 |
{{ .AgentID }} | string | Unique UUID of the specific reporting collector instance. | 019e5ee3-6e53-7e50-a246-052b5365db38 |
{{ .SamplingPercentage }} | float | Tap sampling percentage configured for this agent in the UI slider, applied to every severity (default 10). | 10.0 |
{{ .Insecure }} | bool | Evaluates to false when server URL uses HTTPS; true on plain HTTP. | false |
{{ .TapToken }} | string | Cryptographically signed HMAC-SHA256 authentication token. | GYgr74wZmDHx06bzLGsD246... |
3. Option A: Custom Processor Auto-Chaining
The OpenTelemetry Pipeline Routing Problem
In vanilla OpenTelemetry Collector, declaring a processor under processors: does nothing unless you also find every pipeline in service.pipelines and add that processor to each pipeline's processors: array. In heterogeneous fleets with dozens of different collector topologies, manually updating pipeline arrays is fragile and prone to configuration drift.
How Option A Auto-Chaining Works
With Telemetry Governor's Option A Auto-Chaining:
- Top-Level Declaration: You define custom processors directly under
processors:in the Global Tap Template. - Order Preservation: The template engine parses the YAML AST and strictly preserves your declaration order.
- Signal Affinity Routing: The compiler automatically detects each processor's signal affinity:
- Log Processors (e.g.
filter/named_logs,transform/scrub_logs) → injected intologs/telemetry_governor_errorsandlogs/telemetry_governor_sampled. - Trace Processors (e.g.
filter/span_filter,tail_sampling/custom) → injected intotraces/telemetry_governor_errorsandtraces/telemetry_governor_sampled. - Metric Processors (e.g.
metricstransform/clean,cumulativetodelta) → injected intometrics/telemetry_governor. - Generic Processors (e.g.
attributes/tap_metadata,transform,batch) → injected across all tap pipelines.
- Log Processors (e.g.
- Execution Priority: Custom processors are inserted ahead of built-in Governor error filters and samplers.
- Main Production Pipelines Untouched: Your primary pipelines running to Datadog or Splunk remain completely unaffected.
4. Practical Customization Recipes
Recipe 1: Redacting Sensitive PII & Masking Passwords
Add an OpenTelemetry Transformation Language (OTTL) transform processor to scrub credit card numbers and passwords before tap telemetry ever leaves the host:
processors:
  transform/redact_pii:
    error_mode: ignore
    log_statements:
      - context: log
        statements:
          - replace_pattern(body, "password=[^&\\s]+", "password=REDACTED")
          - replace_pattern(body, "\\b(?:4[0-9]{12}(?:[0-9]{3})?|5[1-5][0-9]{14})\\b", "CC_REDACTED")
    trace_statements:
      - context: span
        statements:
          - replace_pattern(attributes["http.url"], "token=[^&\\s]+", "token=REDACTED")

  probabilistic_sampler/telemetry_governor:
    sampling_percentage: {{ .SamplingPercentage }}
  filter/telemetry_governor_errors_logs:
    error_mode: ignore
    logs:
      log_record:
        - "severity_number < 13"
  filter/telemetry_governor_sampled_logs:
    error_mode: ignore
    logs:
      log_record:
        - "severity_number >= 13"
  filter/telemetry_governor_errors_traces:
    error_mode: ignore
    traces:
      span:
        - "status.code != 2"
  filter/telemetry_governor_sampled_traces:
    error_mode: ignore
    traces:
      span:
        - "status.code == 2"

exporters:
  otlphttp/telemetry_governor_logs:
    logs_endpoint: "{{ .ServerURL }}/api/governor/v1/logs?agent_id={{ .AgentID }}"
    encoding: json
    headers:
      X-CollectorCtrl-Tap-Token: "{{ .TapToken }}"
    tls:
      insecure: {{ .Insecure }}
  otlphttp/telemetry_governor_traces:
    traces_endpoint: "{{ .ServerURL }}/api/governor/v1/traces?agent_id={{ .AgentID }}"
    encoding: json
    headers:
      X-CollectorCtrl-Tap-Token: "{{ .TapToken }}"
    tls:
      insecure: {{ .Insecure }}
  otlphttp/telemetry_governor_metrics:
    metrics_endpoint: "{{ .ServerURL }}/api/governor/v1/metrics?agent_id={{ .AgentID }}"
    encoding: json
    headers:
      X-CollectorCtrl-Tap-Token: "{{ .TapToken }}"
    tls:
      insecure: {{ .Insecure }}
Recipe 2: Dropping Noisy Kubernetes Health Checks
Filter out high-frequency Kubernetes liveness probes (/healthz, /livez) and actuator probes so they do not consume S3 lakehouse storage:
processors:
  filter/drop_health_checks:
    error_mode: ignore
    logs:
      log_record:
        - "body == '/healthz'"
        - "body == '/livez'"
    traces:
      span:
        - "attributes[\"http.target\"] == '/healthz'"
        - "attributes[\"http.target\"] == '/readyz'"
        - "name == 'kube-probe'"

  probabilistic_sampler/telemetry_governor:
    sampling_percentage: {{ .SamplingPercentage }}
  filter/telemetry_governor_errors_logs:
    error_mode: ignore
    logs:
      log_record:
        - "severity_number < 13"
  filter/telemetry_governor_sampled_logs:
    error_mode: ignore
    logs:
      log_record:
        - "severity_number >= 13"
  filter/telemetry_governor_errors_traces:
    error_mode: ignore
    traces:
      span:
        - "status.code != 2"
  filter/telemetry_governor_sampled_traces:
    error_mode: ignore
    traces:
      span:
        - "status.code == 2"

exporters:
  otlphttp/telemetry_governor_logs:
    logs_endpoint: "{{ .ServerURL }}/api/governor/v1/logs?agent_id={{ .AgentID }}"
    encoding: json
    headers:
      X-CollectorCtrl-Tap-Token: "{{ .TapToken }}"
    tls:
      insecure: {{ .Insecure }}
  otlphttp/telemetry_governor_traces:
    traces_endpoint: "{{ .ServerURL }}/api/governor/v1/traces?agent_id={{ .AgentID }}"
    encoding: json
    headers:
      X-CollectorCtrl-Tap-Token: "{{ .TapToken }}"
    tls:
      insecure: {{ .Insecure }}
  otlphttp/telemetry_governor_metrics:
    metrics_endpoint: "{{ .ServerURL }}/api/governor/v1/metrics?agent_id={{ .AgentID }}"
    encoding: json
    headers:
      X-CollectorCtrl-Tap-Token: "{{ .TapToken }}"
    tls:
      insecure: {{ .Insecure }}
Recipe 3: Adding Custom Compliance & Audit Metadata
Inject compliance classification labels into all tapped records:
processors:
  attributes/compliance_tap:
    actions:
      - key: telemetry.governor.captured
        value: "true"
        action: insert
      - key: data.classification
        value: "regulated_audit"
        action: insert

  probabilistic_sampler/telemetry_governor:
    sampling_percentage: {{ .SamplingPercentage }}
  filter/telemetry_governor_errors_logs:
    error_mode: ignore
    logs:
      log_record:
        - "severity_number < 13"
  filter/telemetry_governor_sampled_logs:
    error_mode: ignore
    logs:
      log_record:
        - "severity_number >= 13"
  filter/telemetry_governor_errors_traces:
    error_mode: ignore
    traces:
      span:
        - "status.code != 2"
  filter/telemetry_governor_sampled_traces:
    error_mode: ignore
    traces:
      span:
        - "status.code == 2"

exporters:
  otlphttp/telemetry_governor_logs:
    logs_endpoint: "{{ .ServerURL }}/api/governor/v1/logs?agent_id={{ .AgentID }}"
    encoding: json
    headers:
      X-CollectorCtrl-Tap-Token: "{{ .TapToken }}"
    tls:
      insecure: {{ .Insecure }}
  otlphttp/telemetry_governor_traces:
    traces_endpoint: "{{ .ServerURL }}/api/governor/v1/traces?agent_id={{ .AgentID }}"
    encoding: json
    headers:
      X-CollectorCtrl-Tap-Token: "{{ .TapToken }}"
    tls:
      insecure: {{ .Insecure }}
  otlphttp/telemetry_governor_metrics:
    metrics_endpoint: "{{ .ServerURL }}/api/governor/v1/metrics?agent_id={{ .AgentID }}"
    encoding: json
    headers:
      X-CollectorCtrl-Tap-Token: "{{ .TapToken }}"
    tls:
      insecure: {{ .Insecure }}
Recipe 4: Renaming & Filtering Metrics
Clean up metric naming conventions and remove unwanted gauges without touching logs or traces:
processors:
  metricstransform/clean_metrics:
    transforms:
      - metric_name: system.cpu.utilization
        action: update
        new_name: host.cpu.pct
      - metric_name: jvm.gc.pause
        action: update
        new_name: app.jvm.gc.latency

  probabilistic_sampler/telemetry_governor:
    sampling_percentage: {{ .SamplingPercentage }}
  filter/telemetry_governor_errors_logs:
    error_mode: ignore
    logs:
      log_record:
        - "severity_number < 13"
  filter/telemetry_governor_sampled_logs:
    error_mode: ignore
    logs:
      log_record:
        - "severity_number >= 13"
  filter/telemetry_governor_errors_traces:
    error_mode: ignore
    traces:
      span:
        - "status.code != 2"
  filter/telemetry_governor_sampled_traces:
    error_mode: ignore
    traces:
      span:
        - "status.code == 2"

exporters:
  otlphttp/telemetry_governor_logs:
    logs_endpoint: "{{ .ServerURL }}/api/governor/v1/logs?agent_id={{ .AgentID }}"
    encoding: json
    headers:
      X-CollectorCtrl-Tap-Token: "{{ .TapToken }}"
    tls:
      insecure: {{ .Insecure }}
  otlphttp/telemetry_governor_traces:
    traces_endpoint: "{{ .ServerURL }}/api/governor/v1/traces?agent_id={{ .AgentID }}"
    encoding: json
    headers:
      X-CollectorCtrl-Tap-Token: "{{ .TapToken }}"
    tls:
      insecure: {{ .Insecure }}
  otlphttp/telemetry_governor_metrics:
    metrics_endpoint: "{{ .ServerURL }}/api/governor/v1/metrics?agent_id={{ .AgentID }}"
    encoding: json
    headers:
      X-CollectorCtrl-Tap-Token: "{{ .TapToken }}"
    tls:
      insecure: {{ .Insecure }}
Recipe 5: Explicit Pipeline Overrides
If you ever require custom pipeline topologies (for example, chaining an extra processor only to sampled traces while leaving error traces unmodified), you can explicitly declare service.pipelines directly in the TAP template:
processors:
  transform/enrich_sample:
    error_mode: ignore
    trace_statements:
      - context: span
        statements:
          - set(attributes["sampled.route"], "extended_debug")

service:
  pipelines:
    traces/telemetry_governor_sampled:
      processors:
        - transform/enrich_sample
        - filter/telemetry_governor_sampled_traces
        - probabilistic_sampler/telemetry_governor
When Telemetry Governor detects an explicit service.pipelines definition for any telemetry_governor pipeline, your explicit processor array is honored over auto-chaining.
Recipe 6: Remediating Fragmented Multiline Logs & Stack Traces
A frequent production challenge in distributed fleets is log fragmentation—where a single multi-line Java exception, Go panic, or Python traceback is split into 20–40 individual single-line log records by container runtimes or edge scraping receivers. When this happens:
- The first line (
java.lang.NullPointerException) might be flagged as ERROR, but the following 30 lines containing the stack frames (\tat com.corp.service...) have no severity and are treated as INFO or DEBUG. - In Telemetry Insights, the stack frames show up as a large, routine-looking INFO pattern instead of being grouped with the error they belong to, and they can be suggested for reduction by mistake.
Using Telemetry Governor's Global Tap Template, you can inject OTTL rules that detect orphaned stack frames, tag them, and give them the severity of the error they belong to, so Insights classifies them correctly:
processors:
  transform/remediate_fragmented_exceptions:
    error_mode: ignore
    log_statements:
      - context: log
        statements:
          # Detect common stack trace continuation patterns
          - set(attributes["exception.fragment"], true) where IsMatch(body, "(?m)^(\\s+at\\s+[\\w\\.\\$]+|Caused by:|\\s+\\.\\.\\.\\s+\\d+\\s+more)")
          # Re-classify fragmented stack trace lines to ERROR so Insights groups them with errors
          - set(severity_text, "ERROR") where attributes["exception.fragment"] == true
          - set(severity_number, 17) where attributes["exception.fragment"] == true
          # Mark known panic signatures
          - set(attributes["panic.detected"], true) where IsMatch(body, "(?m)^panic:\\s+")
          - set(severity_text, "FATAL") where attributes["panic.detected"] == true
          - set(severity_number, 21) where attributes["panic.detected"] == true

  probabilistic_sampler/telemetry_governor:
    sampling_percentage: {{ .SamplingPercentage }}
  filter/telemetry_governor_errors_logs:
    error_mode: ignore
    logs:
      log_record:
        - "severity_number < 13"
  filter/telemetry_governor_sampled_logs:
    error_mode: ignore
    logs:
      log_record:
        - "severity_number >= 13"
Once propagated, fragmented exception frames are classified as ERROR (severity 17+) in the tap stream, so Insights shows them as errors and never suggests them for reduction. This changes only the tap's copy of the data, and the tap still samples every severity at the same rate, so it does not deliver complete stack traces.
To keep stack traces whole in your primary backend, join the lines where they are read, for example with the filelog receiver's multiline setting (line_start_pattern) or a recombine operator, in the collector's primary pipeline. Insights helps you find which services need it.