 CollectorCtrl
Telemetry Governor
Data Plane Governance
Telemetry Insights, Recurring Pattern Analysis & Edge Governance Engine
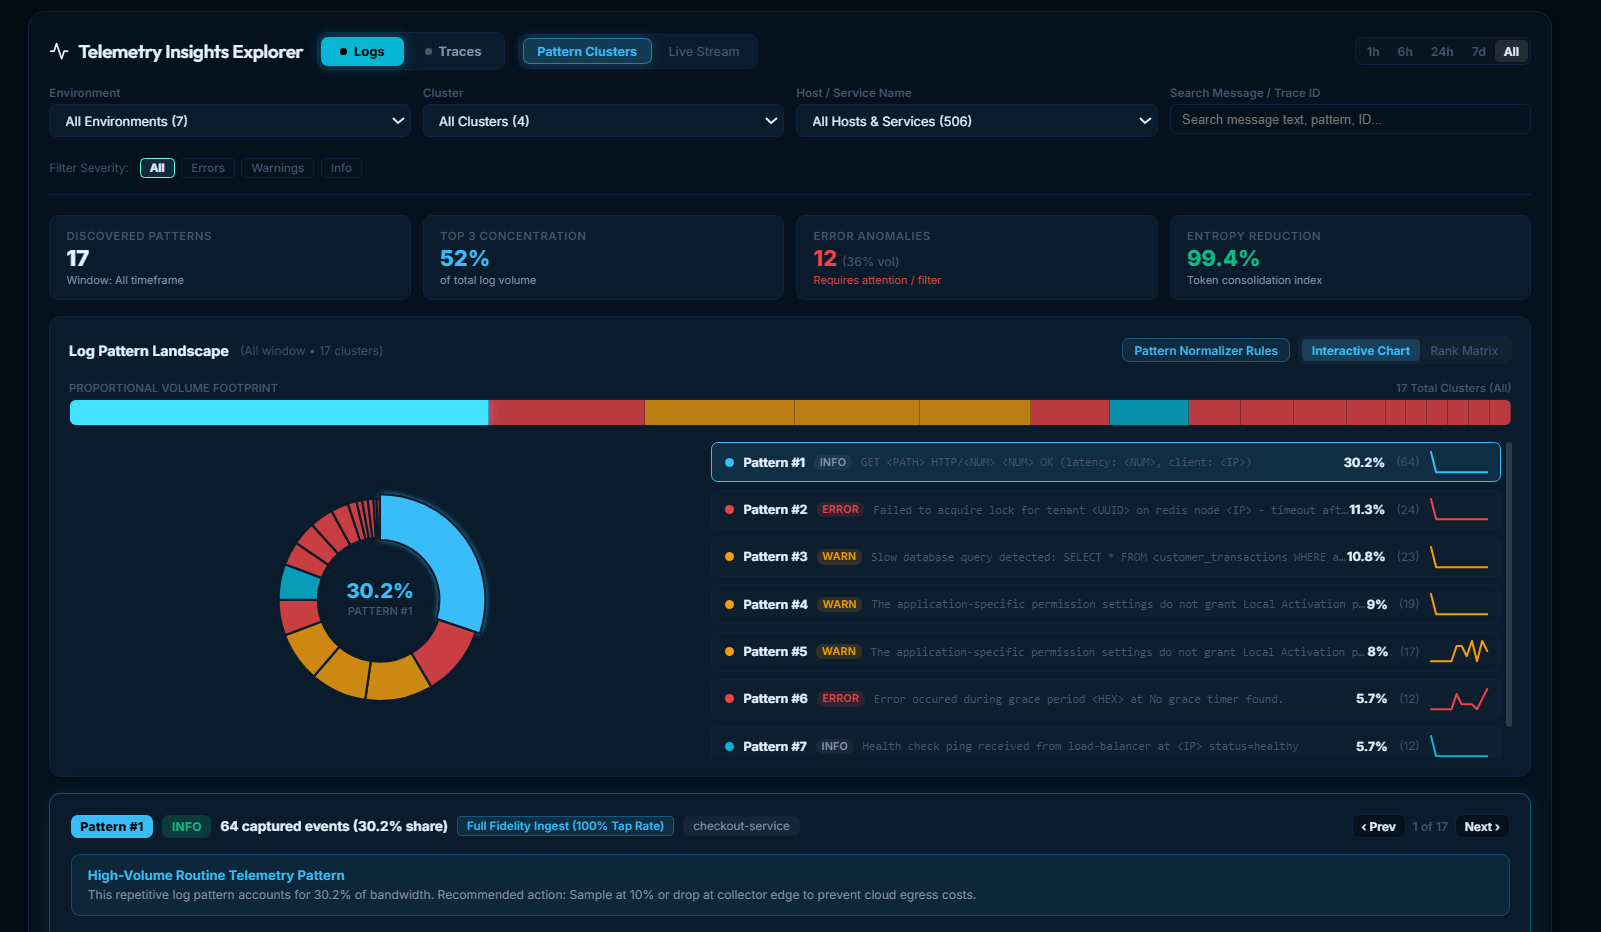
The Telemetry Governor is CollectorCtrl's telemetry insights and governance engine. It taps a uniform sample of each collector's logs and spans (every severity at the same rate, 10% by default), groups the sample into recurring patterns, and ranks them by how often they occur, so platform teams and SREs can see which patterns are worth reducing. You get this without permanently storing raw data.
Governor ranks patterns by what it received. It does not estimate total production volume, cost or savings, and it is not an alerting or error-capture system: confirm a pattern's real volume and investigate individual errors in your observability platform.
It helps engineering teams identify log fragmentation, isolate recurring non-actionable noise, and generate appropriate OpenTelemetry YAML processor configurations that can be deployed back to the fleet via OpAMP to fix issues directly at the source. It also provides deep visibility into APM trace patterns and latency percentiles.
 Expand
How Telemetry Governor Operates
The telemetry tap feature injects non-invasive configuration into the selected collector YAML and adds defined processors and exporters to the collector pipeline:
- Non-Invasive Mirroring: Targeted collectors mirror a uniform sample of their logs and spans (every severity at the same rate) to the CollectorCtrl server over authenticated OTLP/HTTP. Metrics are forwarded unsampled.
- Summarized & Dropped: The sampled data is summarized and visualized in the Telemetry Insights Explorer so you do not have to permanently store raw data. Raw records in the transient hot store are kept for 1 to 7 days maximum and then automatically discarded.
- Optional S3 & OTLP Streaming: If you wish, you can also forward the same sample to Amazon S3 (for on-demand Athena queries) or to an external OTLP endpoint. These destinations receive the sample, not every record.
- Targeted Sampling: Taps can be enabled on selected collectors. Use one sampling percentage across the fleet where you can: pattern counts compare fairly only between sources sampled at the same rate.
Explore Telemetry Governor Features
Navigate into the specialized sections below to explore stream taps, destination management, and YAML tap templating:
Stream Taps & Edge Sampling
Configure one sampling rate for every severity, inspect active taps, and ensure edge self-healing.
Read documentationCommand Center & Fan-Out
Manage multi-destination routing, execute pre-flight connectivity tests, and query S3 Lakehouses with Amazon Athena.
Read documentationGlobal Tap Templates
Customize the fleet-wide YAML tap blueprint with Option A auto-chaining, PII redaction, and OTTL transforms.
Read documentation1. Key Production Use Cases
Rather than making unverified monetary claims, Telemetry Governor provides engineering teams with the analytical capabilities needed to take informed, targeted actions:
1. Recurring Pattern Analysis & Optimization
Rank the most frequent log patterns and span routes per service and source, and identify recurring noise (such as Kubernetes health checks, verbose debug statements, or repeated polling logs). For a chosen pattern, generate a targeted OpenTelemetry filter, sampling or normalize rule, preview it against the stored samples, and apply it at the collector edge.
2. Pattern Summaries for AI Agents
The same pattern ranking is available to AI agents through the MCP server (governor_top_patterns, governor_optimize_preview). Agents can see which recurring patterns dominate a service and draft a rule for review. Because the tap is a sample, agents should use your observability platform for complete error data and individual incidents.
3. Log Fragmentation Discovery & Edge Remediation
Detect split multiline stack traces (such as Java exceptions or Go panics broken into dozens of disconnected single-line log records by container runtimes). Telemetry Governor identifies these fragmented clusters, highlights missing severity levels, and empowers SREs to craft and deploy targeted OpenTelemetry Contrib recombination rules back to the collector fleet to fix log fragmentation at the source.
4. Direct Low-Cost S3 Data Lake Archival
Create parallel pipelines to port the tapped sample directly to an S3 data lake for on-demand Athena SQL queries. The archive holds the sample, not every record, so counts there are counts within the sample.
2. What the Counts Mean
Telemetry Insights reports how many records Governor received. It does not convert them into estimated production volume.
Why one sampling rate for every severity
The tap samples warnings, errors and error spans at the same rate as everything else. Because the sampling is random, a pattern's share of the sample matches its share of the real stream, so the ranking order is reliable within a source and across sources that share a rate.
For example, at 10% a host that logs Order <NUM> placed 100,000 times and Cache hit <*> 50,000 times sends about 10,000 and 5,000 records. The 2:1 ratio, and the ranking, match production.
What it can and cannot show
- Frequent patterns are always seen; rare ones may not be. The chance a pattern that occurred n times is missing from a 10% sample is 0.9ⁿ: about 35% for 10 occurrences, 4% for 30, and effectively 0 for 100 or more. That is fine for finding volume drivers; use your observability platform for alerting and for investigating individual errors.
- Suggestions need enough data. A pattern is suggested for review once it has at least 30 received records (about 300 real occurrences at 10%).
- Mixed rates skew the ranking. A host tapped at 100% outranks a busier host tapped at 1%. Filter to one source, or to sources that share a rate. A rate change during the selected time range also makes the trend jump.
- No volume or savings estimates. To size a pattern's real volume, search for it in your observability platform.
3. End-to-End Processing Architecture
The following diagram illustrates how tapped data flows from edge collectors through the CollectorCtrl server, transient hot store, background digest engine, and decoupled forwarder workers:
End-to-End Processing Architecture
Data plane flow: edge mirroring, memory buffering, transient hot store, and 1-minute pattern rollups
1. Edge Collectors (1,000s of Managed Nodes)
Targeted collectors receive dynamic, non-invasive YAML tap configurations. The collector mirrors a uniform sample of its logs and spans (e.g. 10%, every severity at the same rate) over authenticated OTLP/HTTP. Primary production APM pipelines remain completely isolated with 0ms latency impact.
2. CollectorCtrl Server
Collectors send sampled telemetry directly to the CollectorCtrl server over authenticated HTTP endpoints. The server verifies cryptographic HMAC tap tokens, validates tenant ingest limits, and pushes raw batches into a high-throughput in-memory queue.
Raw batches are flushed every 2s into SQLite or PostgreSQL tables. Kept intentionally small: raw records are stored for 1 to 7 days maximum and then automatically dropped.
Reads only the last 60 seconds of raw rows. Clusters logs and traces by fingerprint, counts each recurring pattern, and appends tiny summary rollups.
The dashboard reads ONLY summary rollups(+ 30–60s in-memory cache). Delivers instantaneous sub-second response times whether your fleet has 10 or 10,000 collectors.
Asynchronous workers stream raw batches to secondary external destinations without adding any network latency or backpressure to edge collectors.
.jsonl.gz) optimized for Amazon Athena and DuckDB queries.Interactive Architecture Inspector
Explore the four pipeline stages below. Click on any stage to inspect runtime specifications, and adjust the sampling rate to see how many records a pattern contributes to the sample:
Telemetry Governor Ingest, Digest & Rollup Architecture
From edge collector tap to transient hot store (1–7 days) and minute-level pattern rollups
Mirrors 10% of every severity to server.
Receives sampled telemetry, verifies HMAC token & buffers raw batches into memory.
Kept small: 1–7 days only. Forwards to S3 Lake / OTLP sinks.
Reads minute digests. Always sub-second fast at 10 or 10,000 nodes.
Targeted collectors receive non-invasive YAML tap configurations. The collector mirrors a uniform X% sample of its logs and spans (every severity at the same rate) over OTLP/HTTP with an HMAC token, leaving primary production pipelines untouched.
4. Safety & Resilience Guarantees
The Telemetry Governor provides four fundamental engineering safeguards:
1. Zero Impact on Primary Pipelines
Primary collector pipelines maintain their own HTTP/gRPC client pools, worker threads, and timeouts. Any network degradation or outage on the Governor ingest endpoint will never block or stall primary APM exports.
2. Asynchronous In-Memory Ring Buffers
The CollectorCtrl backend receives tap payloads into non-blocking memory channels (enqueueTelemetryForward). Edge agents push batches asynchronously, preventing host-level buffer bloat.
3. Fail-Open Dead Letter Storage
If an external S3 bucket or third-party OTLP destination slows down or becomes unreachable, the Governor automatically diverts failed forward jobs into local dead-letter storage (telemetry_dead_letters) rather than creating backpressure upstream.
4. Clean Edge Rollback
When a tap is disabled, CollectorCtrl executes StripTapConfigWithTemplate. All injected tap processors, exporters, and pipelines are cleanly unlinked, returning the collector configuration to its pristine baseline state.
5. Three-Signal Support Matrix
The Telemetry Governor provides native parity across all three OpenTelemetry data models:
| Signal | Filtering Strategy | Sampling Strategy | OTel Collector Compatibility |
|---|---|---|---|
| Logs | Routes error logs (severity >= 13) and non-errors through separate pipelines. | Every severity sampled at the same tap rate via probabilistic_sampler. | Native OTel filter & probabilistic_sampler. |
| Traces | Routes error spans (status.code == 2) and OK spans through separate pipelines. | Every span sampled at the same tap rate by trace ID, so a sampled trace keeps all its spans. | Native OTel filter & probabilistic_sampler. |
| Metrics | Processes all aggregated gauges, sums, and histograms. | Not sampled via probabilistic_sampler (prevents boot failure). | Native OTel metricstransform, attributes, filter. |
In the OpenTelemetry specification, metrics represent pre-aggregated statistical data points (counters, gauges, cumulative histograms). Applying random probabilistic sampling to metrics corrupts mathematical calculations and causes the OpenTelemetry Collector binary to fail configuration validation and refuse to boot.
The Telemetry Governor automatically routes metrics through a dedicated metrics/telemetry_governor pipeline without probabilistic sampling, ensuring configuration validity and metric accuracy.